

Bitcoin Price Stumbles Near $64K—Was The Rebound Just A Trap?
Bitcoin price started a recovery wave above the $62,500 zone. BTC is consolidating and might aim for more gains if it clears the $64,000 resistance zone.
- Bitcoin started a recovery wave and climbed above $62,000.
- The price is trading above $62,200 and the 100 hourly simple moving average.
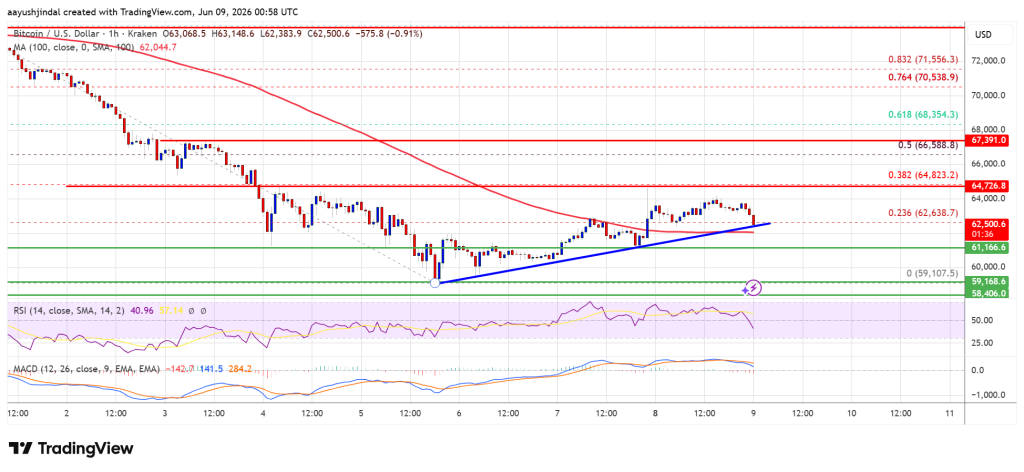
- There is a bullish trend line forming with support at $62,500 on the hourly chart of the BTC/USD pair (data feed from Kraken).
- The pair might gain bullish momentum if it settles above the $64,000 zone.
Bitcoin Price Recovery Faces Resistance
Bitcoin price remained supported above the $60,500 zone. BTC formed a base and settled above $61,500 to start a recovery wave. There was a move above the $62,200 and $62,500 levels.
The price even surpassed the 23.6% Fib retracement level of the downward move from the $74,100 swing high to the $59,106 low. However, the bears seem to be active near $64,000. The price is again moving lower below the $63,200 level.
Bitcoin is now trading above $62,500 and the 100 hourly simple moving average. Besides, there is a bullish trend line forming with support at $62,500 on the hourly chart of the BTC/USD pair.
If the price remains stable above $62,500, it could attempt a fresh increase. Immediate resistance is near the $63,500 level. The first key resistance is near the $64,000 level. A close above the $64,000 resistance might send the price further higher. In the stated case, the price could rise and test the $65,500 resistance. Any more gains might send the price toward the $66,500 level or the 50% Fib retracement level of the downward move from the $74,100 swing high to the $59,106 low. The next barrier for the bulls could be $68,000.
Downside Continuation In BTC?
If Bitcoin fails to rise above the $64,000 resistance zone, it could start another decline. Immediate support is near the $62,500 level.
The first major support is near the $62,200 level. The next support is now near the $61,500 zone. Any more losses might send the price toward the $61,000 support in the near term. The main support now sits at $60,000, below which BTC might struggle to recover in the near term.
Technical indicators:
Hourly MACD – The MACD is now losing pace in the bullish zone.
Hourly RSI (Relative Strength Index) – The RSI for BTC/USD is now below the 50 level.
Major Support Levels – $62,500, followed by $62,000.
Major Resistance Levels – $64,000 and $65,500.


Ayrıca Şunları da Beğenebilirsiniz

Bernstein Says Bitcoin’s Quiet Cycle May Be Healthier Than It Looks

U.S. Spot Ethereum ETFs Extend Inflow Streak to Two Days, Adding $68.17M

Pi Network Faces Hidden Risk as User Fatigue Becomes the Biggest Challenge


Popüler Haberler
Daha fazla
