Highlights: The BNB price is down 2% to $1111.46, despite the trading volume spiking 26%. The BNB on-chain demand has slipped, with the open interest plummeting 3% showing a drop in demand.  The technical outlook shows a tight tug-of-war, with the bulls attempting to overcome resistance zones.  The BNB price is down 2% today, to trade at $1111.46. Despite the plunge, the daily trading volume has soared 26% showing increased market activity among traders. However, BNB Chain has seen declining network activity, with the open interest plummeting, signaling a drop in demand.  On Chain Demand on BNB Cools Off The BNB Chain is in a state of cooldown of network activity, which indicates low on-chain demand. In most instances, when a network fails to ensure large volumes or revenues, it means that there is low demand or outflows to other networks.  BNB DeFi Data: DeFiLlama According to DeFiLlama data, the volume of the Decentralized Exchanges (DEXs) is down to at least $2.12 billion in comparison to the high of $6.313 billion on October 8, which also means low on-chain liquidity.  On the other hand, Coinglass data shows that the volume of BNB has grown by 3.97% to reach $4.95 billion. However, the open interest in BNB futures has dropped by 3.36% to reach $1.74 billion. This reduction in open interest is an indication of a conservative stance by investors since the number of new positions being opened is low. This could be an indication that investors are not so sure about the short-term price outlook. BNB Derivatives Data: CoinGlass Meanwhile, the long-to-short ratio is sitting at 0.9091. This shows that the traders are undecided on BNB price’s next move, as it sits below 1.  BNB Price Moves Into Consolidation The chart displays the BNB/USD price action on a 4-hour timeframe, with the token currently hovering around $1111.46. The 50-day Simple Moving Average (SMA) is at $1113, while the 200-day SMA sits at $1129, cushioning the bulls against upside movement. The price has mostly been trending below both SMAs, indicating that the bears are having the upper hand.  The BNB trading volume is up, soaring 26%, signaling the momentum is real. On the 4-hour chart, BNB is trading within a consolidation channel. In such a case, this pattern may act as an accumulation period, giving the bulls hind wings to break above resistance zones.  BNB/USD 4-hour chart: TradingView Zooming in, the Relative Strength Index (RSI) sits at 44.15, below the 50 level. This shows weakening momentum in the BNB market, and might lead to the RSI plunging to the oversold region if the bulls don’t regain control. In the short term, the BNB price could move up to $1113 resistance and flip it into support. A close above this zone will see the bulls target $1126 resistance, giving the bulls strength to reclaim the $1230 mark.  Conversely, if the resistance zones prove too strong, a dip towards $1012 could be plausible. In such a case, this could be a prime buy zone for the risk-takers. In the long term, if the token keeps the hype alive, the bulls may reclaim the $1375 high or higher. eToro Platform Best Crypto Exchange Over 90 top cryptos to trade Regulated by top-tier entities User-friendly trading app 30+ million users 9.9 Visit eToro eToro is a multi-asset investment platform. The value of your investments may go up or down. Your capital is at risk. Don’t invest unless you’re prepared to lose all the money you invest. This is a high-risk investment, and you should not expect to be protected if something goes wrong. Highlights: The BNB price is down 2% to $1111.46, despite the trading volume spiking 26%. The BNB on-chain demand has slipped, with the open interest plummeting 3% showing a drop in demand.  The technical outlook shows a tight tug-of-war, with the bulls attempting to overcome resistance zones.  The BNB price is down 2% today, to trade at $1111.46. Despite the plunge, the daily trading volume has soared 26% showing increased market activity among traders. However, BNB Chain has seen declining network activity, with the open interest plummeting, signaling a drop in demand.  On Chain Demand on BNB Cools Off The BNB Chain is in a state of cooldown of network activity, which indicates low on-chain demand. In most instances, when a network fails to ensure large volumes or revenues, it means that there is low demand or outflows to other networks.  BNB DeFi Data: DeFiLlama According to DeFiLlama data, the volume of the Decentralized Exchanges (DEXs) is down to at least $2.12 billion in comparison to the high of $6.313 billion on October 8, which also means low on-chain liquidity.  On the other hand, Coinglass data shows that the volume of BNB has grown by 3.97% to reach $4.95 billion. However, the open interest in BNB futures has dropped by 3.36% to reach $1.74 billion. This reduction in open interest is an indication of a conservative stance by investors since the number of new positions being opened is low. This could be an indication that investors are not so sure about the short-term price outlook. BNB Derivatives Data: CoinGlass Meanwhile, the long-to-short ratio is sitting at 0.9091. This shows that the traders are undecided on BNB price’s next move, as it sits below 1.  BNB Price Moves Into Consolidation The chart displays the BNB/USD price action on a 4-hour timeframe, with the token currently hovering around $1111.46. The 50-day Simple Moving Average (SMA) is at $1113, while the 200-day SMA sits at $1129, cushioning the bulls against upside movement. The price has mostly been trending below both SMAs, indicating that the bears are having the upper hand.  The BNB trading volume is up, soaring 26%, signaling the momentum is real. On the 4-hour chart, BNB is trading within a consolidation channel. In such a case, this pattern may act as an accumulation period, giving the bulls hind wings to break above resistance zones.  BNB/USD 4-hour chart: TradingView Zooming in, the Relative Strength Index (RSI) sits at 44.15, below the 50 level. This shows weakening momentum in the BNB market, and might lead to the RSI plunging to the oversold region if the bulls don’t regain control. In the short term, the BNB price could move up to $1113 resistance and flip it into support. A close above this zone will see the bulls target $1126 resistance, giving the bulls strength to reclaim the $1230 mark.  Conversely, if the resistance zones prove too strong, a dip towards $1012 could be plausible. In such a case, this could be a prime buy zone for the risk-takers. In the long term, if the token keeps the hype alive, the bulls may reclaim the $1375 high or higher. eToro Platform Best Crypto Exchange Over 90 top cryptos to trade Regulated by top-tier entities User-friendly trading app 30+ million users 9.9 Visit eToro eToro is a multi-asset investment platform. The value of your investments may go up or down. Your capital is at risk. Don’t invest unless you’re prepared to lose all the money you invest. This is a high-risk investment, and you should not expect to be protected if something goes wrong.

BNB Price Drops 2% as the Dex Volume Tumbles Cautioning Further Downside

2025/10/29 20:19

Highlights:

  • The BNB price is down 2% to $1111.46, despite the trading volume spiking 26%.
  • The BNB on-chain demand has slipped, with the open interest plummeting 3% showing a drop in demand. 
  • The technical outlook shows a tight tug-of-war, with the bulls attempting to overcome resistance zones. 

The BNB price is down 2% today, to trade at $1111.46. Despite the plunge, the daily trading volume has soared 26% showing increased market activity among traders. However, BNB Chain has seen declining network activity, with the open interest plummeting, signaling a drop in demand. 

On Chain Demand on BNB Cools Off

The BNB Chain is in a state of cooldown of network activity, which indicates low on-chain demand. In most instances, when a network fails to ensure large volumes or revenues, it means that there is low demand or outflows to other networks. 
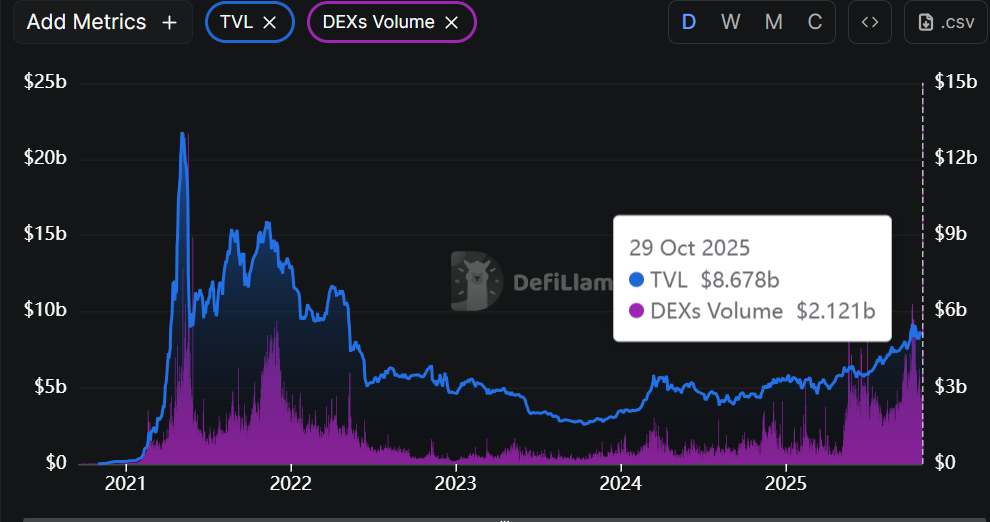
BNB DeFi Data: DeFiLlama

According to DeFiLlama data, the volume of the Decentralized Exchanges (DEXs) is down to at least $2.12 billion in comparison to the high of $6.313 billion on October 8, which also means low on-chain liquidity. 

On the other hand, Coinglass data shows that the volume of BNB has grown by 3.97% to reach $4.95 billion. However, the open interest in BNB futures has dropped by 3.36% to reach $1.74 billion. This reduction in open interest is an indication of a conservative stance by investors since the number of new positions being opened is low. This could be an indication that investors are not so sure about the short-term price outlook.

BNB Derivatives Data: CoinGlass

Meanwhile, the long-to-short ratio is sitting at 0.9091. This shows that the traders are undecided on BNB price’s next move, as it sits below 1. 

BNB Price Moves Into Consolidation

The chart displays the BNB/USD price action on a 4-hour timeframe, with the token currently hovering around $1111.46. The 50-day Simple Moving Average (SMA) is at $1113, while the 200-day SMA sits at $1129, cushioning the bulls against upside movement. The price has mostly been trending below both SMAs, indicating that the bears are having the upper hand. 

The BNB trading volume is up, soaring 26%, signaling the momentum is real. On the 4-hour chart, BNB is trading within a consolidation channel. In such a case, this pattern may act as an accumulation period, giving the bulls hind wings to break above resistance zones. 
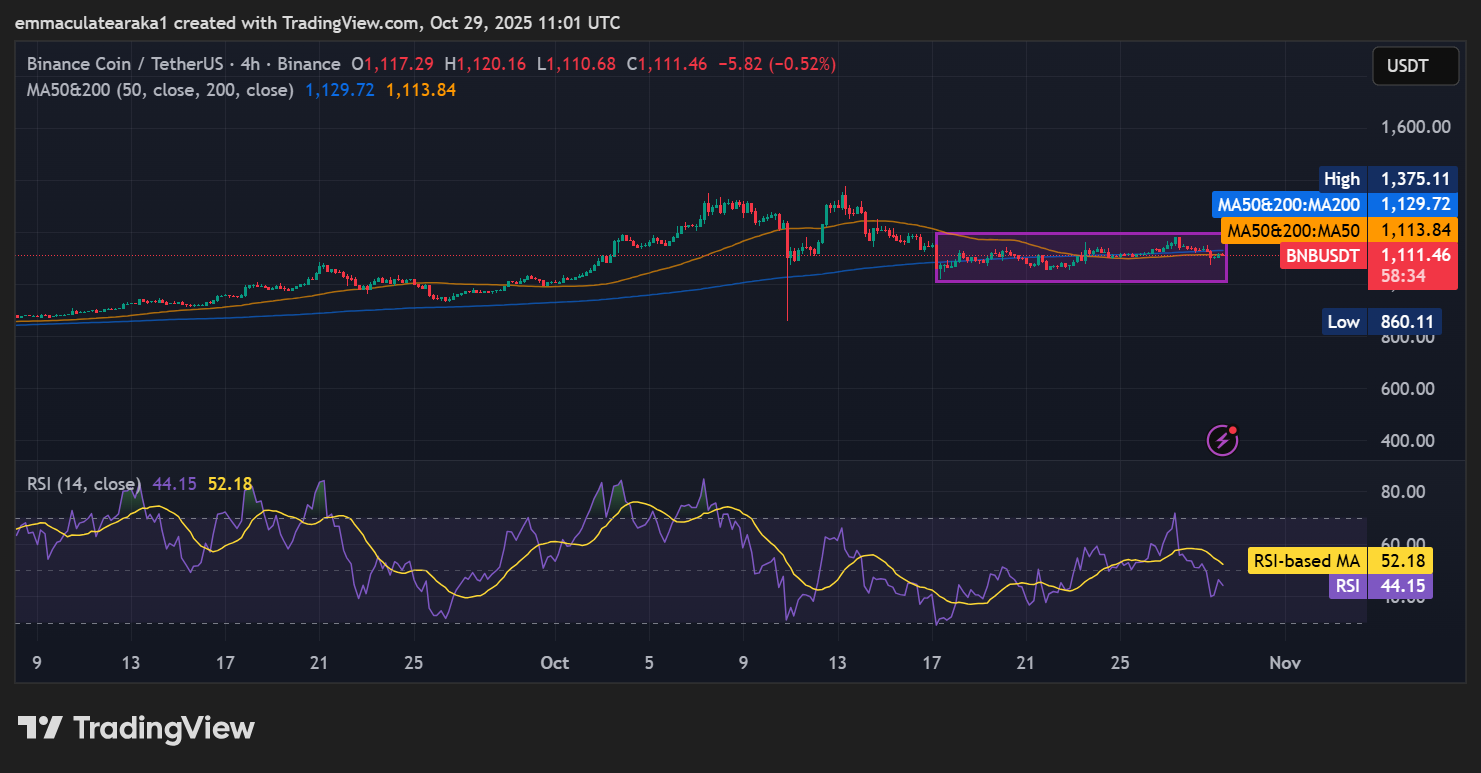
BNB PriceBNB/USD 4-hour chart: TradingView

Zooming in, the Relative Strength Index (RSI) sits at 44.15, below the 50 level. This shows weakening momentum in the BNB market, and might lead to the RSI plunging to the oversold region if the bulls don’t regain control. In the short term, the BNB price could move up to $1113 resistance and flip it into support. A close above this zone will see the bulls target $1126 resistance, giving the bulls strength to reclaim the $1230 mark. 

Conversely, if the resistance zones prove too strong, a dip towards $1012 could be plausible. In such a case, this could be a prime buy zone for the risk-takers. In the long term, if the token keeps the hype alive, the bulls may reclaim the $1375 high or higher.

eToro Platform

Best Crypto Exchange

  • Over 90 top cryptos to trade
  • Regulated by top-tier entities
  • User-friendly trading app
  • 30+ million users
9.9
Visit eToro

eToro is a multi-asset investment platform. The value of your investments may go up or down. Your capital is at risk. Don’t invest unless you’re prepared to lose all the money you invest. This is a high-risk investment, and you should not expect to be protected if something goes wrong.

Disclaimer: The articles reposted on this site are sourced from public platforms and are provided for informational purposes only. They do not necessarily reflect the views of MEXC. All rights remain with the original authors. If you believe any content infringes on third-party rights, please contact service@support.mexc.com for removal. MEXC makes no guarantees regarding the accuracy, completeness, or timeliness of the content and is not responsible for any actions taken based on the information provided. The content does not constitute financial, legal, or other professional advice, nor should it be considered a recommendation or endorsement by MEXC.
Share Insights

You May Also Like

“Circle Just Solved the $29 Trillion Crypto Adoption Problem

“Circle Just Solved the $29 Trillion Crypto Adoption Problem

Circle’s new project, ARC Testnet, has caught the financial world’s attention for one reason: the list of participants is staggering. BlackRock, Goldman Sachs, Visa, Mastercard, and Deutsche Bank are all tied in. But the real breakthrough lies in a simple innovation, USD-denominated gas fees. By allowing blockchain transactions to be paid directly in dollars rather than volatile crypto, Circle may have just eliminated the final obstacle keeping $29 trillion in global pension funds out of the digital asset markets. For years, institutional investors have hesitated to enter crypto not because of lack of infrastructure, but because of operational risk tied to crypto-denominated fees and fluctuating assets. Circle’s ARC testnet bypasses that entirely, creating a compliance-friendly environment where gas can be paid in stablecoins. This seemingly small detail creates massive implications. Suddenly, large funds can settle, custody, and transact entirely within a digital framework that still operates in fiat terms. That’s an open invitation for financial institutions that already manage tens of trillions in traditional markets. While ARC mainnet is not expected until 2026, insiders say budget allocations for pilot programs are already happening now. Financial institutions are treating ARC preparedness as a 2025 line item. The timing could not be more strategic given that Circle’s anticipated IPO will require a strong growth narrative. By positioning ARC as the missing layer between traditional money and blockchain efficiency, Circle is painting itself as the company that can finally merge the financial system’s past and future. If the rollout continues smoothly, the stablecoin issuer could pivot from utility provider to infrastructure backbone for institutional crypto adoption. Circle’s pitch isn’t about speculation anymore, it’s about owning the rails of the next global financial upgrade. “Circle Just Solved the $29 Trillion Crypto Adoption Problem was originally published in Coinmonks on Medium, where people are continuing the conversation by highlighting and responding to this story
Share
Medium2025/10/30 14:46
Speculation as Culture

Speculation as Culture

We used to build things because we believed in them. Now, we build because someone might buy them. Speculation isn’t just a financial behavior anymore — it’s a cultural operating system. From crypto tokens to content virality to design trends, we live in a world where potential value has replaced real value. Everything is a pre-launch, a teaser, a drop. Even ideas are traded like assets, inflated with hype before they ever mature. Web3 was supposed to decentralize ownership, but what it really decentralized was attention. We all became investors in narratives. Every creator is now a startup; every tweet is an IPO. The new capitalism isn’t about production — it’s about participation in momentum. The problem? Momentum doesn’t create meaning. Design has absorbed this sickness too. Products are released half-finished, optimized for FOMO instead of function. Brands trade authenticity for aesthetics that look “investable.” And creatives — once obsessed with craft — are now caught in loops of engagement farming. It’s not “What did you make?” anymore. It’s “How many noticed before it was over?” Speculation rewards velocity, not vision. It turns creativity into a casino, where we keep betting on our own relevance. Even the language of art has shifted — “drops,” “floor price,” “community alpha.” We stopped talking about what something means and started asking what it’s worth. This economy of anticipation keeps us in a constant state of almost. We’re always on the verge of the next thing — but nothing lands, nothing lingers. Attention, like capital, has become liquidity. To create meaning again, design has to resist this speculative loop. It has to slow down, to reclaim patience as a form of rebellion. The future shouldn’t just be bought early — it should be built deliberately. Because right now, speculation is our culture’s addiction. And the house always wins. Speculation as Culture was originally published in Coinmonks on Medium, where people are continuing the conversation by highlighting and responding to this story
Share
Medium2025/10/30 14:46